Welcome to the comprehensive guide that unveils the power of heat mapping in Google Analytics, your ultimate tool for unlocking invaluable website insights.
Whether you’re a business owner looking to optimize your website’s performance or a digital marketer aiming to enhance conversion rates, heat mapping is an indispensable feature that can catapult your online success to new heights.
With heat mapping, you’ll gain a visual representation of your website’s visitor behavior, allowing you to understand how users interact with your pages.
By pinpointing hotspots, or areas of high activity, you’ll uncover what elements are capturing attention, driving engagement, and ultimately leading to conversions.
Armed with this knowledge, you can make data-driven decisions to improve user experience, optimize your website’s layout, and increase your conversions.
In this guide, we’ll delve into the world of heat mapping step-by-step, demystifying its functionality and highlighting its strategic benefits. We’ll explore the different types of heat maps, explain how they work, and provide actionable tips on how to interpret their findings to drive meaningful improvements on your website.
Get ready to harness the full potential of heat mapping and take your online performance to the next level. Let’s dive in!

Understanding The Importance Of Website Insights For Heat Mapping In Google Analytics
In today’s digital landscape, having a website is no longer enough. To truly succeed online, you need to understand how your website is performing and how users are interacting with it.
This is where website insights come into play. By gaining a deeper understanding of your website’s performance, you can make informed decisions to improve user experience, increase conversions, and ultimately grow your business.
Website insights provide valuable information about user behavior, allowing you to identify areas of improvement and optimize your website accordingly. With heat mapping, you can go beyond traditional analytics and gain a visual representation of user behavior.
By tracking and analyzing how users interact with your website, you can uncover valuable insights that can drive meaningful improvements.
What Is Heat Mapping And How Does It Work?
At its core, heat mapping is a visual representation of data that shows the areas of a website that receive the most and least attention from visitors. It does this by using color-coded overlays to indicate the level of engagement or activity on specific areas of a webpage. The hotter the color, the more attention that area is receiving.
Heat maps are generated by tracking user interactions on a webpage, such as mouse movements, clicks, and scrolling behavior. This data is then aggregated and displayed in a visually appealing format that allows website owners and marketers to quickly identify patterns and areas of interest.
To implement heat mapping on your website, you’ll need to integrate Google Analytics and utilize a heat mapping tool such as Hotjar or Crazy Egg. These tools collect and analyze user data, providing you with valuable insights to optimize your website’s performance.
Types Of Heat Maps In Google Analytics

Google Analytics offers several types of heat maps that can provide different insights into user behavior. These include click maps, scroll maps, and movement maps.
Click HeatMap
Click Maps Show where visitors are clicking on your website. By analyzing click maps, you can identify which elements, such as buttons or links, are receiving the most attention. This information can help you optimize the placement and design of important elements to improve user experience and drive conversions.
Scroll Maps
Scroll Maps indicate how far visitors are scrolling down a webpage. By understanding how users are interacting with your content, you can optimize the placement of important information and ensure that key messages are being seen.
Movement Maps
Movement Maps track the movement of a visitor’s mouse cursor. By analyzing movement maps, you can gain insights into how users are navigating your website and which areas are attracting the most attention.
Each type of heat map provides unique insights into user behavior and can help you make data-driven decisions to improve your website’s performance.
How To Create Heat Mapping in Google Analytics on Website
Heat Mapping is an incredibly visual analytical method that offers valuable insights into your website’s customer traffic patterns. By utilizing this approach, you can gain a comprehensive understanding of how visitors navigate through your site.
Here’s a breakdown of the steps involved in implementing this strategy:
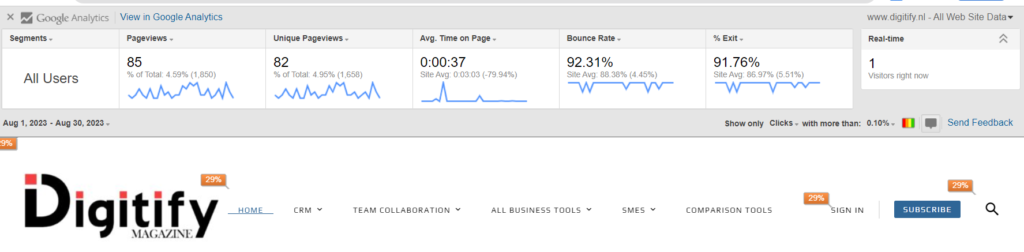
- Begin by installing the Google Page Analytic Chrome Extension.
- Access your Google Analytics account using your designated username and password.
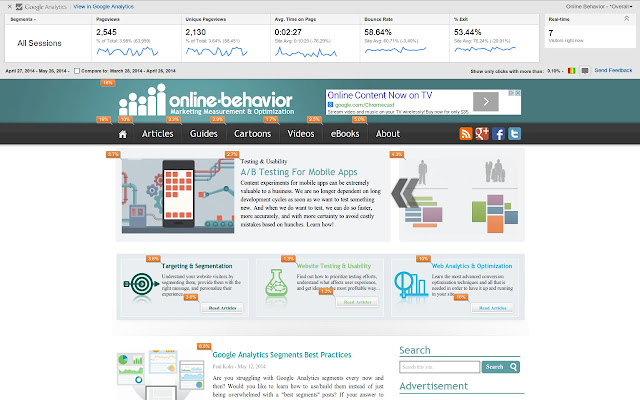
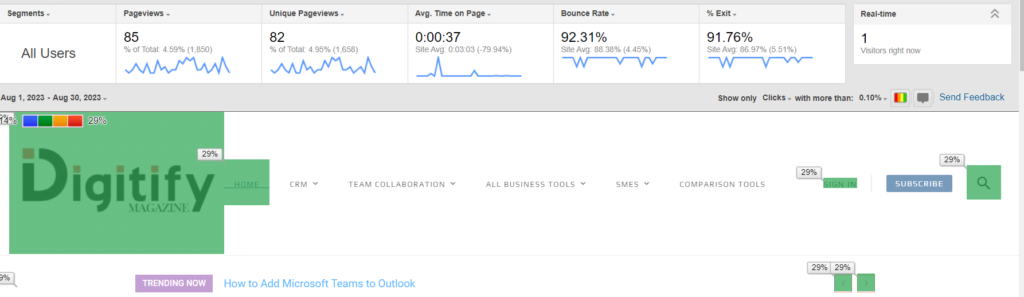
- Navigate to your landing page to gain insights into user behavior and interactions with your website.
- As you analyze different sections of the website, take note of the click-through rates across various sections. As a digital marketing analyst, your primary objective is to enhance the number of clicks and identify specific user actions, such as engagement with form-filling options or CTA buttons.
- In this instance, you’ve observed a total of 100 clicks.
- Your aim is to optimize the performance further, with a target of achieving 300 clicks on the form.
- Once you’ve gathered this data, collaborate with the development team to communicate the findings and guide them in implementing improvements.
- Incorporating heat mapping as part of your analytical toolkit enables you to visually comprehend user interactions and optimize your website’s performance for enhanced user engagement and conversion.
Analyzing User Behavior With Heat Maps
Now that you understand the different types of heat maps available, it’s time to dive into the analysis process. Analyzing user behavior with heat maps involves interpreting the data and identifying actionable insights.
When analyzing heat maps, look for patterns and trends. Are there specific areas of your website that consistently receive high engagement? Are there elements that users are ignoring or not interacting with? By identifying these patterns, you can make informed decisions to optimize your website’s layout and improve user experience.
It’s also important to consider the context of your website and its goals. What actions do you want users to take? Are they taking those actions? Heat maps can help you identify areas where users are dropping off or not engaging as expected, allowing you to make targeted improvements to your conversion funnel.
Interpreting Heat Map Data And Making Data-Driven Decisions
Once you have analyzed your heat map data, it’s time to turn those insights into action. By making data-driven decisions, you can optimize your website to improve user experience, increase engagement, and drive conversions.
Start by identifying areas of high engagement on your heat map. These hotspots indicate elements that are capturing users’ attention and driving interaction. Consider how you can leverage these hotspots to further engage your audience. For example, if a specific section of your homepage receives a lot of clicks, you can experiment with adding more compelling content or calls-to-action in that area.
On the flip side, look for areas of low engagement or cold spots. These areas may indicate elements that are being overlooked by users. Consider whether these elements are necessary or if they can be optimized or removed. By focusing on areas of low engagement, you can streamline your website and ensure that every element is serving a purpose.
Using Heat Maps For Conversion Rate Optimization (CRO)
One of the main benefits of heat mapping is its ability to drive conversion rate optimization (CRO). By understanding how users are interacting with your website, you can identify bottlenecks in your conversion funnel and make targeted improvements to increase conversions.
Start by analyzing your heat maps in relation to your conversion goals. Are users dropping off at a specific point in the funnel? Are there areas of high engagement that can be leveraged to drive conversions? By answering these questions, you can create an action plan to optimize your website for conversions.
Consider conducting A/B tests to validate your hypotheses. By making small changes and measuring their impact on user behavior, you can fine-tune your website to maximize conversions. Heat mapping can provide valuable insights into the effectiveness of these changes, allowing you to make data-driven decisions to improve your conversion rates.
Implementing Heat Mapping On Your Website
Ready to implement heat mapping on your website? The process is relatively straightforward, but it does require some technical integration.
First, make sure you have Google Analytics set up on your website. This will serve as the foundation for your heat mapping analysis. If you haven’t already, create a Google Analytics account and add the tracking code to your website.
Next, choose a heat mapping tool that integrates with Google Analytics. Popular options include Hotjar, Crazy Egg, and Lucky Orange. Each tool has its own set of features and pricing plans, so choose the one that best fits your needs.
Once you have chosen a heat mapping tool, follow the installation instructions provided by the tool’s documentation. This typically involves adding a code snippet to your website, similar to how you added the Google Analytics tracking code.
Once the tool is installed, it may take some time for data to start populating in your heat maps. Be patient and check back regularly to start analyzing the data and uncovering insights.
Common Misconceptions About Heat Mapping
While heat mapping is a powerful tool for understanding user behavior, there are some common misconceptions that need to be addressed.
Firstly, heat mapping is not a one-size-fits-all solution. Different websites have different goals and user behaviors, so it’s important to interpret heat map data in the context of your specific website and business objectives.
Secondly, heat maps should not be the sole basis for decision-making. Heat mapping provides valuable insights, but it should be used in conjunction with other data sources, such as user surveys, usability testing, and A/B testing. By combining multiple sources of data, you can gain a more comprehensive understanding of user behavior and make more informed decisions.
Lastly, heat mapping is not a set-it-and-forget-it tool. User behavior and website performance can change over time, so it’s important to regularly analyze heat map data and make ongoing improvements. Use heat mapping as a continuous feedback loop to optimize your website and stay ahead of the curve.
Conclusion And Next Steps
Congratulations! You’ve now unlocked the power of heat mapping in Google Analytics and have the tools and knowledge to drive meaningful improvements on your website. By understanding user behavior, interpreting heat map data, and making data-driven decisions, you can optimize your website’s performance, improve user experience, and increase conversions.
Remember, heat mapping is just one tool in your digital marketing arsenal. Combine it with other strategies such as SEO, content marketing, and social media to create a holistic approach to online success.
So what are you waiting for?
Start implementing heat mapping on your website today and unlock the insights that will take your online performance to the next level. Happy mapping!
—
This blog article provides a comprehensive guide to heat mapping in Google Analytics. It starts by emphasizing the importance of website insights and introduces the concept of heat mapping.
It then explores the different types of heat maps available in Google Analytics and provides actionable tips on how to analyze and interpret heat map data.
The article also highlights the strategic benefits of using heat mapping for conversion rate optimization (CRO) and provides step-by-step instructions on how to implement heat mapping on a website. Additionally, it addresses common misconceptions about heat mapping and concludes with a call to action for readers to start unlocking the power of heat mapping on their own websites.