Google Analytics is one of the most valuable products that Google provides. Businesses use Google Analytics to receive real-time website analytics and reporting to make better business decisions based on the data.
As they say,
“With a large amount of data comes a large amount of responsibility.”
Taking one step further in Google Analytics, Google introduced the Google Analytics Heat map.
What is Google Analytics Heat Map?
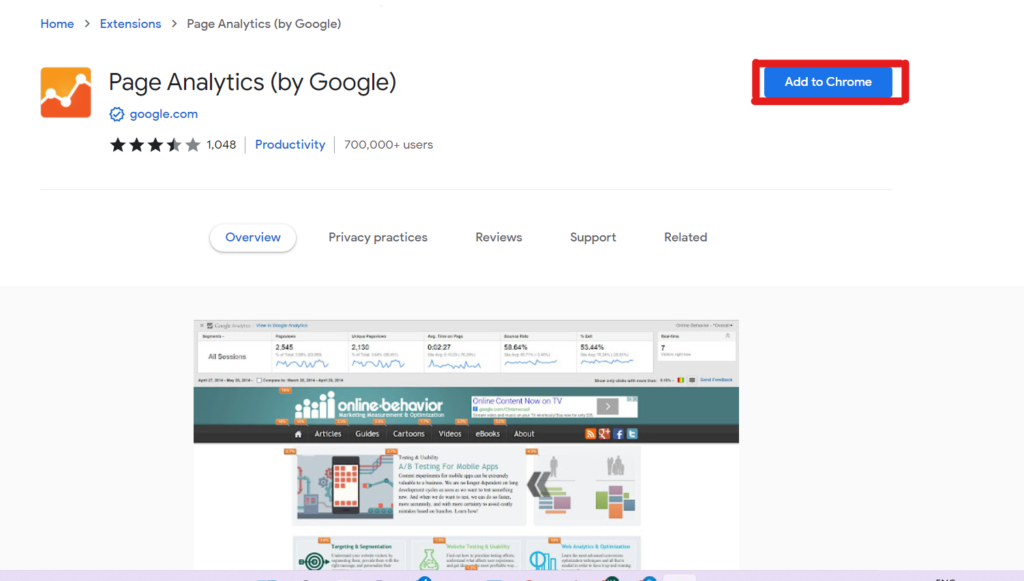
Google has just developed a Chrome addon called Page Analytics that allows you to construct a Heatmap using Google Analytics data.
Heat maps are graphical representations of particular metric values. A heat map is a visual representation of the data on your website, and it displays you where people click on your web pages once it’s installed.
Critical advantages of Google’s heat map extension
- Overview of website performance.
- Visual Representation of data for better understanding.
- It works backward and leverages data from your Google Analytics account.
- It works on any page with the GA tracking code installed and does not impose any restrictions on page views.
- Using real-time traffic, you can segment visitors and view heat maps.
- See how visitors interact with your website. If you want an engaged audience and a more significant discussion rate, you must understand your users’ behavior and leverage it.
How Does Heat Map Work?
The Google Analytics heat map is simple to create and use.
- The first step is to create a Google Analytics account (skip this step if you already have a Google Analytics account) and configure your website with the code provided by Google Analytics for each web page you want to track.
- Download page analytics extension. Once you have a click map for each website page in your browser, you’re ready to examine your website.
- After that, you’ll notice an icon at the bottom of the screen. Please turn it on.
- Login to your Google Analytics account and Link Page Analytics.

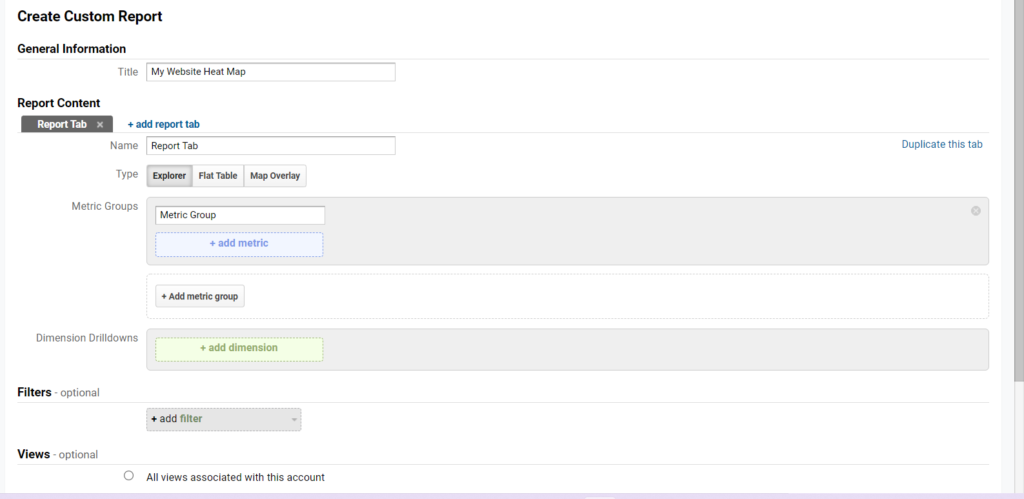
Create the Custom Report
- In the custom menu on the right side of your website, select Customization. Then, under New Report, type in a title for your report, such as Heatmap.
- In the dimensions section, enter the metrics you wish to track and the days of the week and hours.
- You can also select a specific optional section of data that you wish to keep an eye on.
- After completing this, you can view your report and select the date range from the upper right side.
- You can now specify the period that your heat map should cover. If you only have a little information, use a date range that covers a lot of ground.


Conclusion
The Google analytics heat map allows you to analyze your site data and provides you with in-depth insights into the viewers, allowing you to improve strategies to attract your target viewers.